

In today’s volatile stock market, making informed decisions is crucial for success. While fundamental analysis focuses on a company’s financial health and qualitative factors, technical analysis delves into price movements and market trends. Mastering technical analysis can provide traders with valuable insights into when to buy, sell, or hold stocks.
So, how can you effectively use technical analysis to navigate the complexities of the stock market?
Understanding Technical Analysis
Technical analysis involves studying historical market data, primarily price and volume, to predict future price movements. It operates under the assumption that market trends tend to repeat themselves, and past price behavior can provide insights into future performance.
Key Concepts and Tools
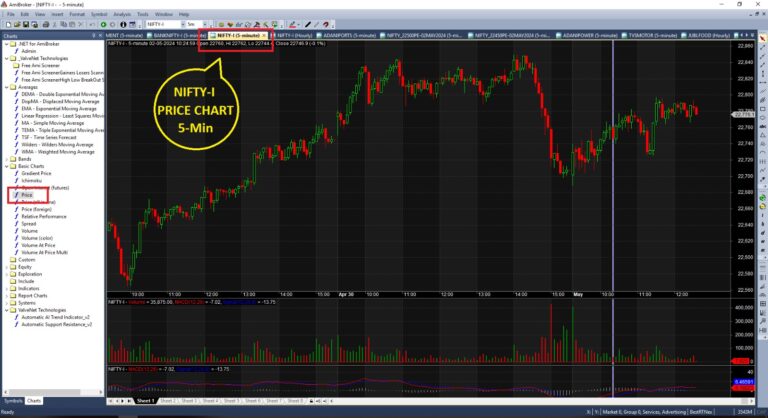
- Price Charts: Price charts, such as candlestick charts, bar charts, and line charts, visually represent price movements over a specific time frame. Analyzing these charts can help identify patterns and trends.
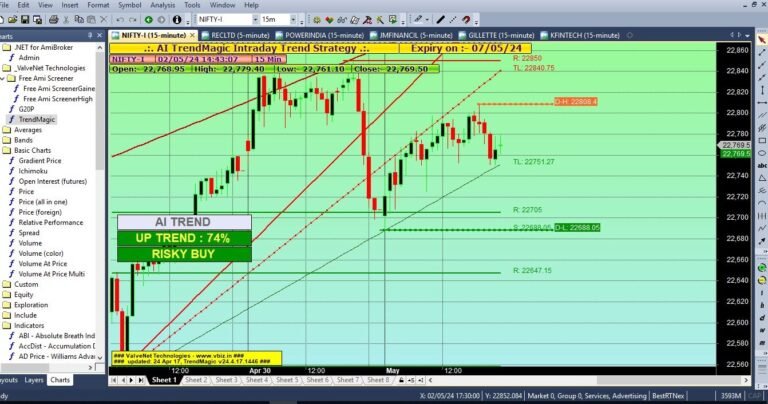
- Support and Resistance Levels: Support levels are price points where a stock tends to find buying interest, preventing it from falling further. Resistance levels, on the other hand, are price points where selling pressure is evident, preventing the stock from rising. Recognizing these levels can aid in making strategic trading decisions.
We are currently introducing an AI Trend magic strategy which Predicts the strong buy and strong sell and it makes your trading more easier . It will also create multiple support levels and resistance levels which will make it easier and save your time. To get the Trend Predictor for free. Just checkout the link if you want and explore more in that predictor.
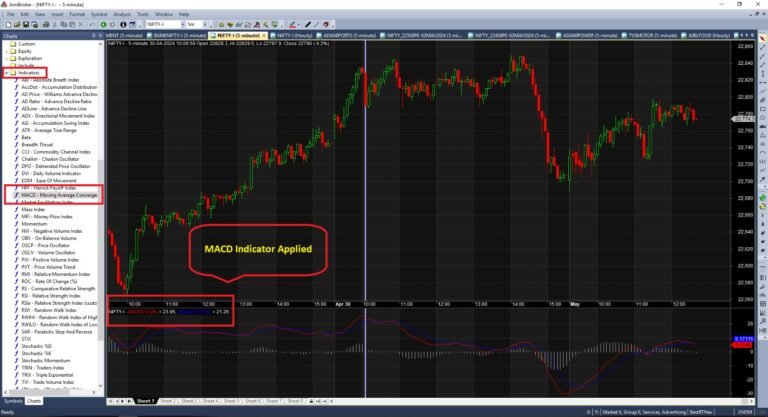
- Technical Indicators: Technical indicators, such as moving averages, relative strength index (RSI), and stochastic oscillators, help traders analyze price movements and identify potential buying or selling opportunities.
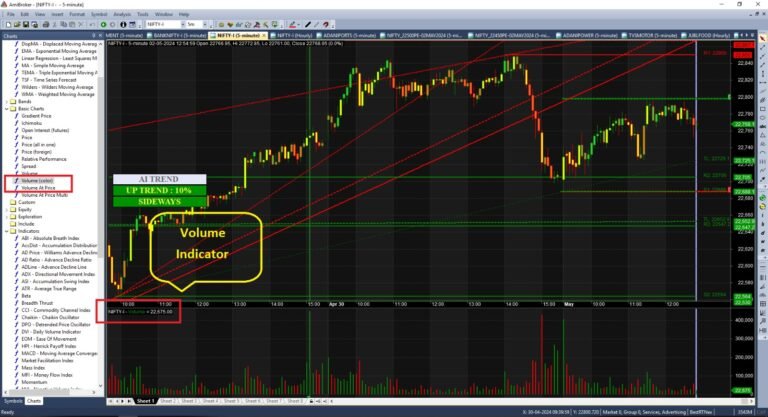
- Volume Analysis: Volume, or the number of shares traded, is a critical component of technical analysis. Changes in volume can confirm price trends and signal potential reversals.
Implementing Technical Analysis
- Identifying Trends: Technical analysts often use trendlines to identify the direction of a stock’s price movement. Trends can be upward (bullish), downward (bearish), or sideways (consolidation). Understanding the prevailing trend is essential for making informed trading decisions.
- Confirming Signals: Technical analysis is not about relying on a single indicator but rather using multiple indicators to confirm signals. For example, if a stock’s price is approaching a resistance level while the RSI indicates overbought conditions, it may signal a potential reversal.
- Risk Management: Successful trading involves managing risk effectively. Technical analysis can help traders set stop-loss orders to limit potential losses and protect profits.
Conclusion
Mastering technical analysis empowers traders to make informed decisions in the stock market. By understanding key concepts, utilizing essential tools, and implementing effective strategies, traders can navigate market fluctuations with confidence. Whether you’re a seasoned investor or a novice trader, incorporating technical analysis into your trading arsenal can enhance your ability to achieve success.