Analyze-the-real-time-data-for-amibroker

How to Analyze Real-time Market Data Using Best Live Charts

In today’s fast-paced world of stock market trading, having access to real-time data is invaluable. For Intraday traders, every second counts, and making informed decisions quickly can make all the difference between profit and loss. This is where live charts come into play. In this article, we’ll explore the benefits of using live charts for technical analysis, how they can enhance your trading strategies, and why platforms like Amibroker are essential tools for modern traders.

Table of Contents

Live charts provide real-time data on stock prices, volume, and other market indicators. Unlike static charts, live charts update dynamically, allowing traders to see the most current market conditions at a glance.

SUBHEADINGS KEY POINTSBENEFITS OF TRADERS
UNDERSTANDING LIVE CHARTSLive charts show real-time market data including price movements and volumes.Helps traders make informed decisions and track market dynamics.
REAL-TIME DATA FOR INTRADAY TRADERSProvides up-to-the-second data essential for timely trading.Enables precise execution of trades and quick reactions to market changes.
THE POWER OF VISUALIZATIONVisual representation of data aids in spotting trends and patterns.Facilitates quicker and easier identification of trading opportunities.
ANALYZING MARKET TRENDSTracks trends and patterns as they develop in real-time.Assists in adapting trading strategies to current market conditions.
IDENTIFYING THE ENTRY AND EXIT POINTSUses technical indicators and price action to find optimal trade points.Improves the accuracy of trade entries and exits.
CUSTOMIZATION AND PERSONALIZATIONAllows adjustment of chart settings, indicators, and color schemes.Tailors charts to individual trading preferences and strategies.
INTEGRATING LIVE CHARTS WITH AMIBROKERCombines live charts with Amibroker’s advanced tools and customizable features.Enhances technical analysis and trading strategies.
ENHANCING TECHNICAL ANALYSISProvides real-time data and various charting tools for in-depth analysis.Strengthens market analysis and decision-making capabilities.
STAYING AHEAD WITH ALERTS AND NOTIFICATIONSIncludes alert features for significant market events and price movements.Keeps traders informed and responsive to market changes.
OVERCOMING PSYCHOLOGICAL BARRIERSData-driven approach reduces emotional trading.Helps traders maintain discipline and make rational decisions.

1. Understanding Live Charts

Understanding live charts is crucial for traders as they provide real-time visual representations of market data, such as price movements and trading volumes. By analyzing these charts, traders can identify trends, patterns, and key levels, helping them make informed decisions and execute trades effectively.

2. Real-Time Data for Intraday Traders

For intraday traders, timing is everything. Live charts offer up-to-the-second data, enabling traders to react quickly to market movements and execute trades with precision.

Intraday-traders-real-time-data

3. The Power of Visualization

Humans are visual beings, and live charts provide a visual representation of market data. This visual feedback makes it easier for traders to spot patterns, trends, and potential trading opportunities.

4. Analyzing Market Trends

By observing live charts, traders can identify market trends and patterns as they unfold. Whether it’s a bullish rally or a bearish trend, live charts help traders stay informed and adapt their strategies accordingly.

5. Identifying Entry and Exit Points

One of the key advantages of live charts is their ability to pinpoint entry and exit points for trades. Traders can use technical indicators and price action analysis on live charts to make well-informed decisions.

6. Customization and Personalization

Many live chart platforms offer customization options, allowing traders to tailor their charts to suit their unique trading styles and preferences. From color schemes to technical indicators, the possibilities are endless.

live-charts-amibroker-data

7. Integrating Live Charts with Amibroker

Amibroker is a popular platform among traders for its powerful analysis tools and customizable features. By integrating live charts with Amibroker, traders can take their technical analysis to the next level.

8. Enhancing Technical Analysis

Live charts enhance the effectiveness of technical analysis by providing real-time data and visualizations. Traders can use various charting tools and indicators to analyze market trends and make informed decisions.

9. Staying Ahead with Alerts and Notifications

Live chart platforms often include alert features that notify traders of significant market events or price movements. These alerts help traders stay ahead of the curve and capitalize on opportunities as they arise.

10. Overcoming Psychological Barriers

Trading can be emotionally challenging, but live charts help traders stay focused and disciplined. By relying on data and analysis rather than emotions, traders can overcome psychological barriers and make rational trading decisions.


pros-and-cons-real-time-charts

Conclusion: Embrace the Future of Trading with Live Charts

In conclusion, live charts are indispensable tools for intraday traders, providing real-time data, visualization, and analysis capabilities. By harnessing the power of live charts and platforms like Amibroker, TradingView traders can stay ahead of the curve and navigate the complexities of the stock market with confidence.

FAQs

1. What are live charts, and why are they important for traders?

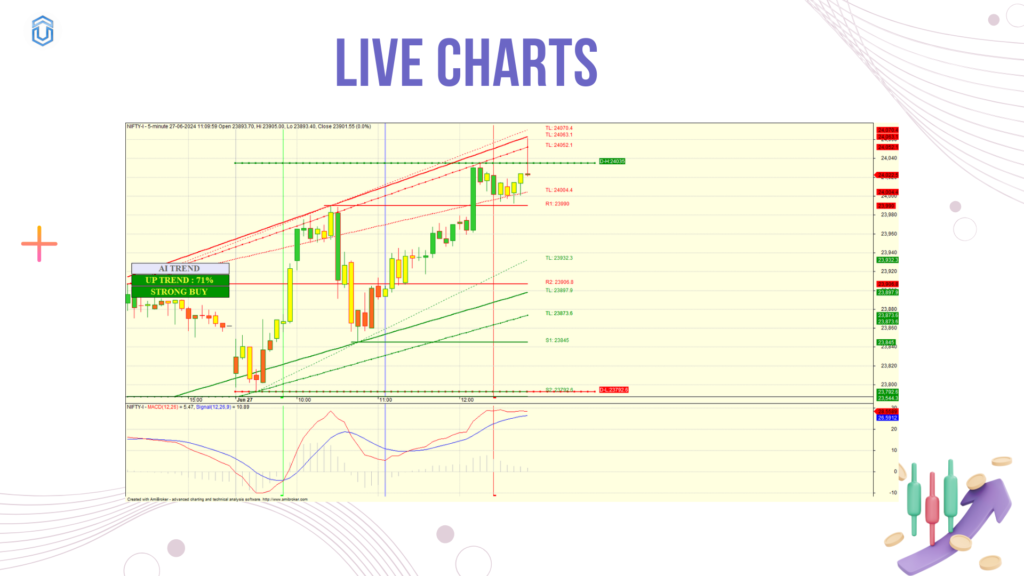
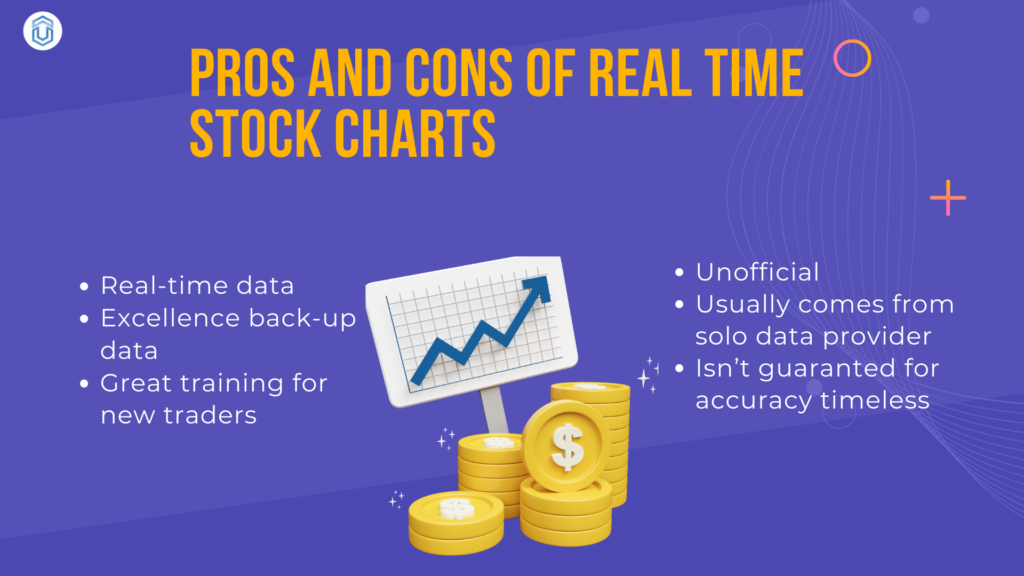
Live charts display real-time data on stock prices and market indicators, enabling traders to make informed decisions quickly.

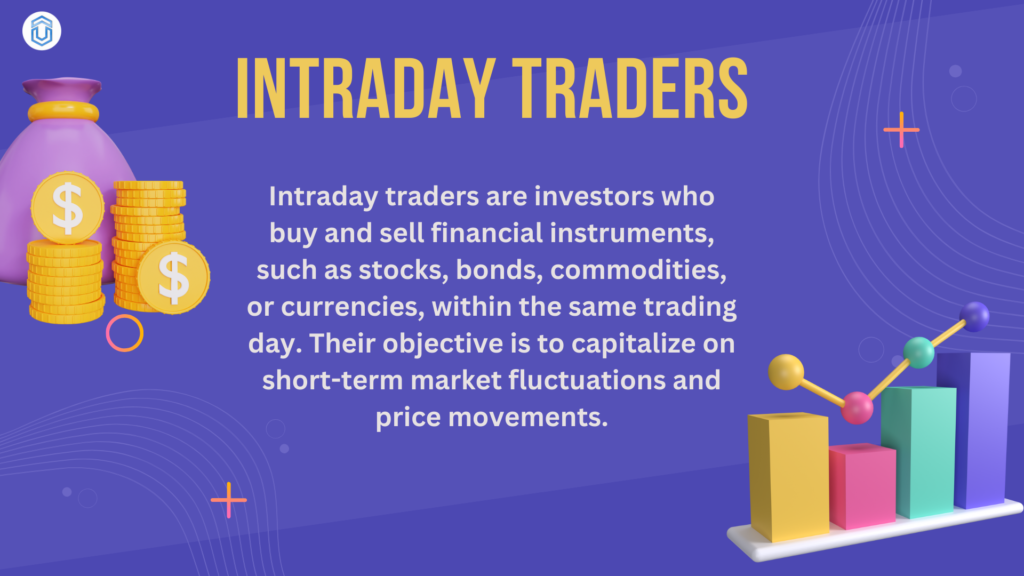
2. How can live charts help intraday traders?

Live charts provide up-to-the-second data, allowing intraday traders to react swiftly to market movements and identify trading opportunities.

3. What is Amibroker, and how does it complement live charts?

Amibroker is a trading analysis software that integrates with live charts, offering advanced analysis tools and customizable features to enhance technical analysis.

4. How do live charts assist in identifying market trends?

By visually representing market data in real-time, live charts help traders spot trends and patterns as they emerge, facilitating trend analysis and strategy development.

5. Can live charts help traders overcome emotional biases?

Yes, by relying on data-driven analysis rather than emotions, traders can use live charts to overcome psychological barriers and make rational trading decisions.

“Get a free trial of real-time stock market data now!📊

Leave a Reply

Your email address will not be published. Required fields are marked *