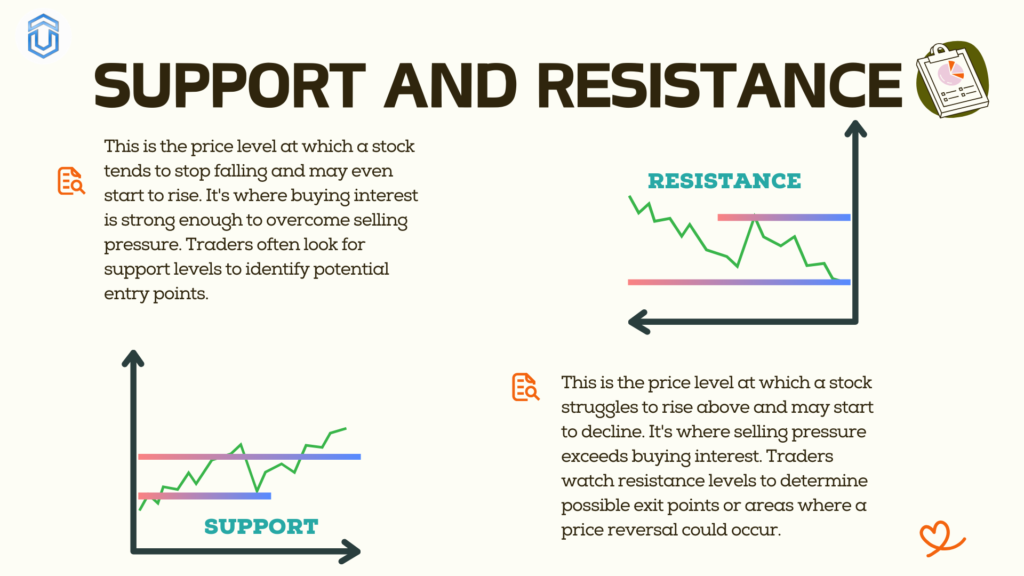
In the realm of technical analysis, support and resistance are pivotal concepts that traders rely on to make informed decisions. Understanding these levels can be the difference between success and failure in the volatile world of financial markets.
Support
This refers to a price level at which a security or asset tends to find buying interest, preventing it from falling further. In essence, support acts as a floor for prices, as buyers are more inclined to purchase the asset at that level, thus creating demand that prevents the price from declining.
Resistance
On the other hand, resistance represents a price level at which selling interest tends to emerge, hindering further upward movement of the asset’s price. Resistance acts as a ceiling for prices, as sellers are more willing to sell the asset at that level, creating supply that prevents the price from rising.

Key Takeaways
- Support and resistance are crucial concepts in technical analysis, influencing traders’ decision-making processes.
- Fibonacci retracement levels serve as valuable guides for identifying entry and exit points, as well as managing risk.
- By leveraging Fibonacci retracement, traders can enhance their trading strategies and increase their chances of success in the markets.
Well-Known Indicators
Moving Averages
Moving averages are among the most widely used indicators for identifying support and resistance. They smooth out price data to reveal underlying trends, making them adept at highlighting key levels. The simple moving average (SMA) and exponential moving average (EMA) are two primary variations, each offering unique insights.
Fibonacci Retracement
Fibonacci Retracement is a popular tool used in technical analysis to help traders determine potential support and resistance levels in financial markets.
First, you need to spot a clear trend in the price of an asset (like a stock or cryptocurrency). This can be an upward trend (prices going up) or a downward trend (prices going down).

Pivot Points
Pivot points are calculated based on the previous day’s high, low, and close, providing traders with a roadmap for potential support and resistance levels. These levels are especially popular among intraday traders seeking quick, actionable insights.
Bollinger Bands
Bollinger Bands consist of a simple moving average accompanied by upper and lower bands representing standard deviations from the mean. When the price touches or breaches these bands, it often signals overbought or oversold conditions, indicating potential support or resistance levels.
Time Frame Considerations
It’s essential to consider the timeframe when utilizing support and resistance indicators. Shorter timeframes, such as intraday trading, may require more frequent adjustments to support and resistance levels due to increased volatility.
Conversely, longer timeframes, such as weekly or monthly charts, offer more stable support and resistance levels, providing a broader perspective on market movements.
Determine the Best Indicator
Amidst a plethora of options, discerning the best indicator for support and resistance can be challenging. However, after meticulous analysis and extensive testing, one indicator stands out above the rest: Fibonacci retracement.
Entry and Exit Points
Identifying optimal entry and exit points is crucial for maximizing profits and minimizing losses. Fibonacci retracement levels serve as valuable guides in this regard.
- Entry Points: Traders often look to enter positions near key Fibonacci retracement levels, especially when they coincide with other technical indicators or chart patterns signaling a potential reversal.
- Exit Points: Similarly, traders may consider exiting positions or taking profits when the price approaches significant Fibonacci retracement levels, anticipating a potential reversal or consolidation.

How to become a strong Traders, Easy ways to learn
Understand the Basics:
Learn about different trading instruments, market dynamics, and basic trading strategies. Resources such as online courses, books, and tutorials can provide a solid foundation for beginners.
Choose Your Market:
Whether you prefer stocks, forex, options, or cryptocurrencies, focusing on one market initially can help you develop expertise more efficiently.
Develop a Trading Plan:
Regularly review and refine your plan as you gain experience and adjust to changing market conditions.
Practice Patience and Discipline:
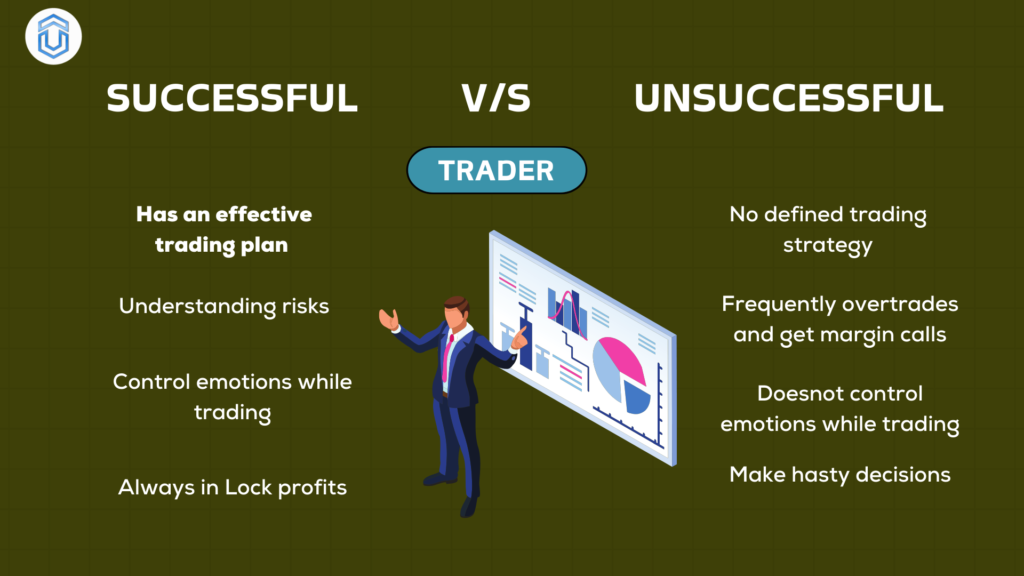
Trading requires patience and discipline to avoid impulsive decisions and stick to your trading plan. Avoid chasing “hot tips” or succumbing to fear and greed.
Utilize Technology and Tools:
Use charting platforms, technical analysis tools, and trading algorithms to identify potential trading opportunities and make informed decisions. Stay informed with real-time market data and news updates to adapt quickly to market developments.
Learn from Experience:
Experience is one of the most valuable teachers in trading. Start with small trades and gradually increase your position size as you gain confidence and experience.
Continuously Educate Yourself:
The financial markets are constantly evolving, so it’s crucial to stay updated and continuously educate yourself.
Read more: Live NSE, BSE and MCX data for Amibroker

